


The Baltic Sea is one of the shallowest seas in the world. Its depth, combined with a large inflow of fresh waters, carrying numerous loads of nutrients, leads to the bloom of cyanobacteria. This more and more frequent phenomenon in the Baltic Sea makes it difficult for all tourists who come to the seaside to relax. All this is due to eutrophication – excessive water nutrition.
The aim of the marine waters protection program – aPOWM, is to stop the pollution of the Baltic Sea, and eutrophication is one of the 11 features that contribute to maintaining or improving the good environmental status of marine waters. One of the basic elements negatively affecting the condition of the Baltic Sea are nutririents – nitrogen and phosphorus compounds that are carried by rivers that supply the Baltic Sea in large numbers. Both of these elements occur in nature in different forms. In the natural environment, nitrogen is most commonly present in the gas form – N2, which is the main component of air. The present form of nitrogen is ammonia – NH3, which is produced by the decomposition of organic matter. The oxygen form of nitrogen compounds are nitrates (the formula of the nitrate ion -NO3) and nitrites (the formula of the nitrite ion -NO2). Both nitrite and nitrate ions are soluble in water and therefore they are displaced with it. Changes in nitrogen between its various forms are called the nitrogen cycle in nature. In the case of phosphorus, the most common form is phosphate (-PO4). Limiting the inflow of these nutrients to rivers is one of the key challenges in the protection of the Baltic Sea.
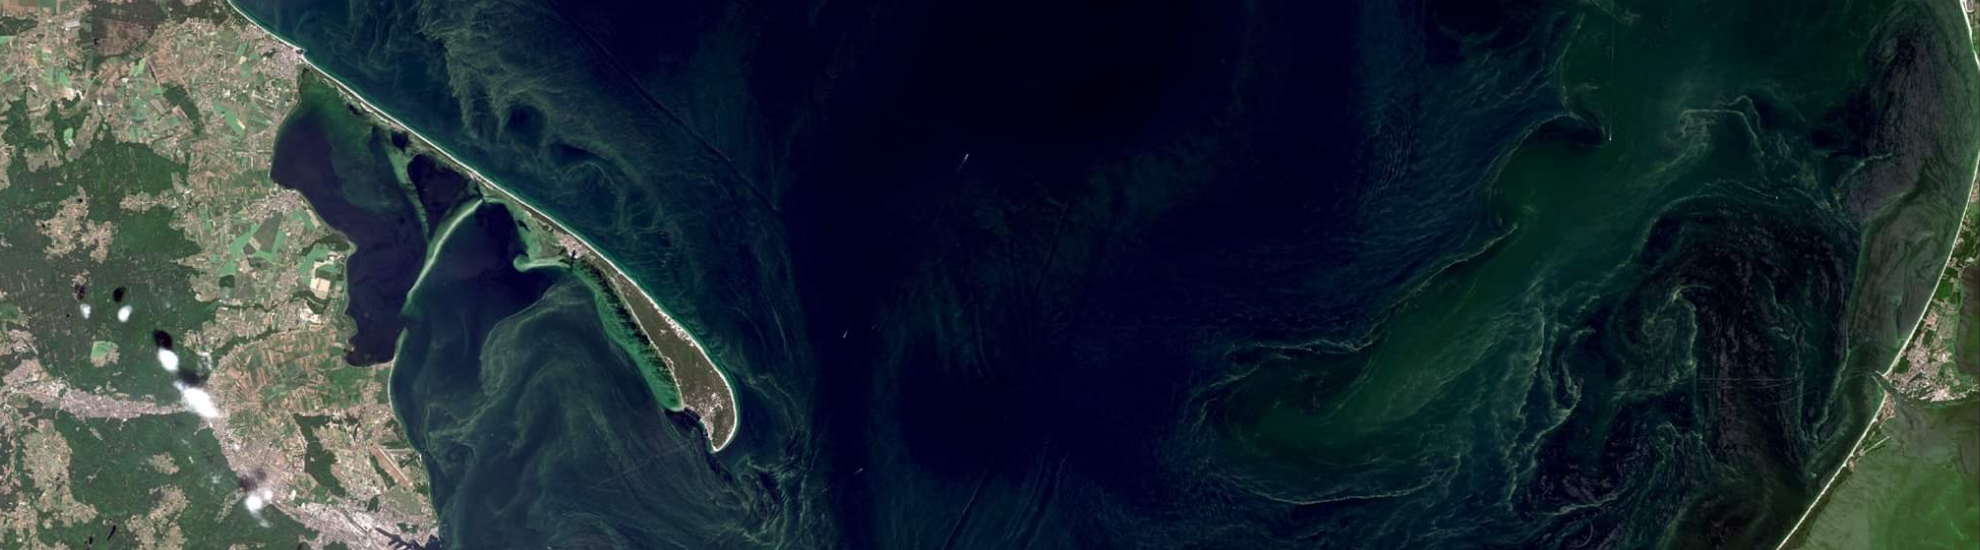
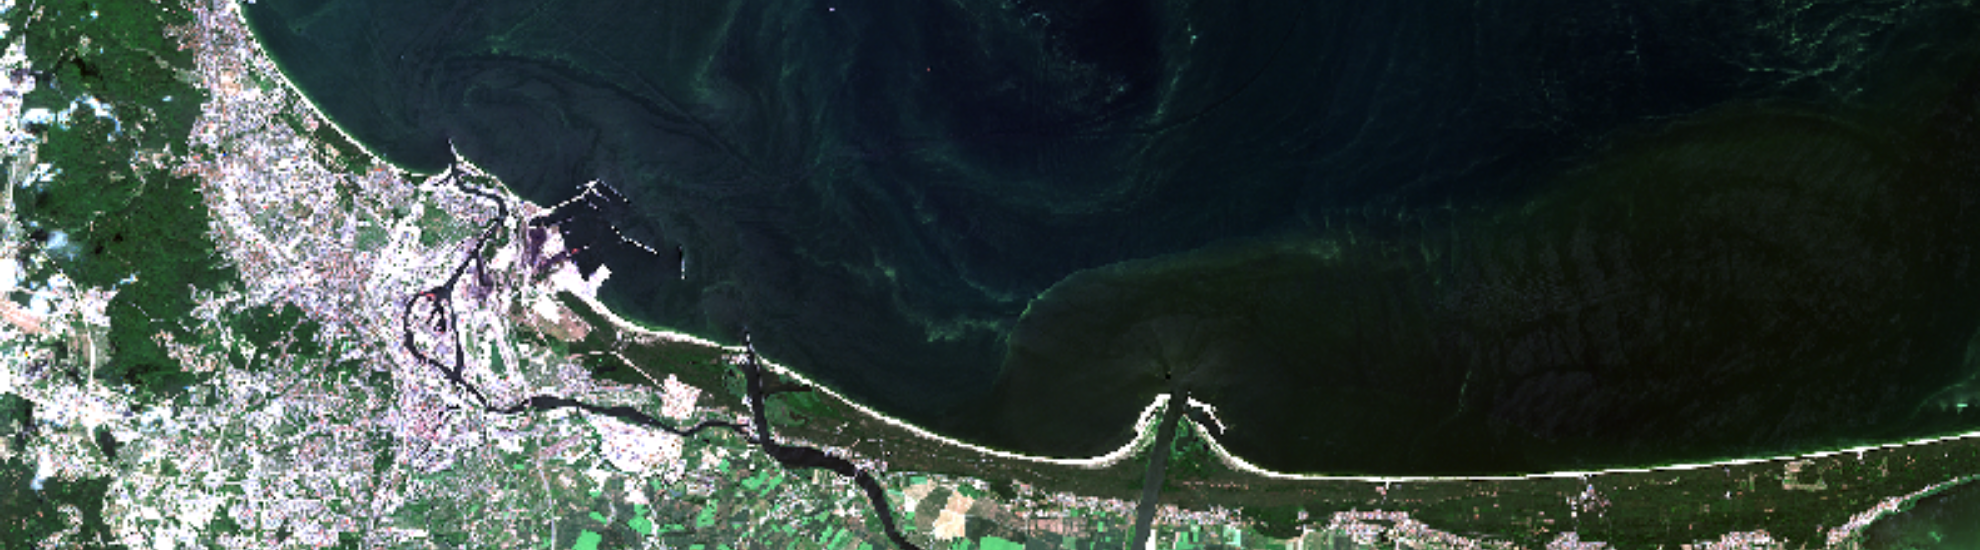
Source: Copernicus Sentinel Data [2021],processed at the Satellite Teledetection Department, IMWM-PIB
Sources of eutrophication
According to the BALANCE OF LOADS OF POLLUTANTS DISCHARGED BY RIVERS TO THE BALTIC SEA – PLC 7 prepared by Poland in 2020, reported to HELCOM, the general structure of loads “at source”, according to the categories included in the balance, is presented in the table below. As shown in it, agriculture is the absolute largest source responsible for two-thirds of both nitrogen (67%) and phosphorus (66%) reaching Polish surface waters. The second largest source, i.e. municipal sewage treatment plants, accounts for only 9% of nitrogen and 14% of phosphorus. The third place, with a share of 7% in the nitrogen balance and 5% in the phosphorus balance, is occupied by the transboundary loads, followed closely by the natural background of 5% in relation to the nitrogen and phosphorus balance. It is worth noting that we have virtually no influence on the amount of loads from the last two categories mentioned. The remaining 9 categories account for only 12% nitrogen and 9% phosphorus. Sanitary wastewater from non-sewage areas accounts for only 4% of nitrogen and 3% of phosphorus.
Source of nutritients | Nitrogen [%] | Phosporus [%] |
Direct communal point sources | 0,26 | 0,19 |
Intermediate municipal point sources | 0,01 | 0,01 |
Intermediate municipal point sources | 9,32 | 13,68 |
Indirect industrial point sources | 2,61 | 0,81 |
Indirect point sources – aquaculture | 0,61 | 1,20 |
City runoffs and combined sewer systems transfers | 1,01 | 1,79 |
Sanitary sewage from non-sewage areas | 4,31 | 2,94 |
Agriculture | 66,41 | 67,07 |
Direct atmospheric deposition | 1,49 | 0,56 |
Forests and wastelands | 1,55 | 1,57 |
Natural background | 5,46 | 5,06 |
Cross-border cargo | 6,91 | 5,12 |
Unknown origin loads | 0,05 | 0,00 |
Source: Study of the balance of pollution loads discharged by rivers into the Baltic Sea – PLC 7 for HELCOM
The structure of nitrogen and phosphorus loads at the source is presented below, taking into account the division into five “regions”, ie the Vistula within Poland, the Oder within Poland, the basins of the Przymorze, Pregoła and Niemen rivers and cross-border catchments.


Source: Study of the balance of pollution loads discharged by rivers into the Baltic Sea – PLC 7 for HELCOM
Discharges of sewage from ships are also significant in the case of the Baltic Sea. It was not until 2016 that a ban on discharging sewage by vessels directly into the Baltic Sea was introduced.
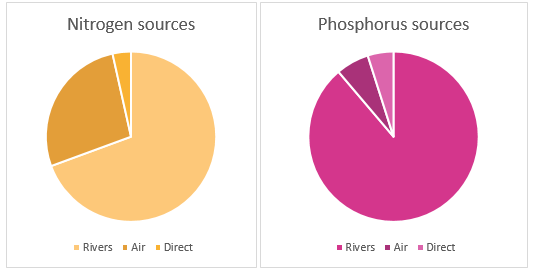
In the case of the Baltic Sea, the greatest amount of nutrients comes from the rivers flowing into it (Fig. 1). According to the data of the Helsinki Commission, the Vistula River introduces 9% of nitrogen and 16% of phosphorus, and the rivers of the Odra River supply 6% of nitrogen and 8% of phosphorus entering the Baltic Sea, respectively.
Source: Study of the balance of pollution loads discharged by rivers into the Baltic Sea – PLC 7 for HELCOM
Nutrient surpluses reaching the Baltic Sea cause a number of unfavorable phenomena. The key one is eutrophication, i.e. water fertilization.
Dead zones
The basic parameters describing eutrophication are nitrogen and phosphorus concentrations in sea water. Their growth in water leads to the development of phytoplankton. Its quantity is the second criterion for assessing the intensity of the eutrophication process. It is measured in the form of chlorophyll concentration in water. The development of phytoplankton disturbs the transparency of the water. Therefore, it is transparency that is an indicator that is the criterion for assessing eutrophication. For the rapid development of phytoplankton, in addition to nutrients, oxygen is also needed, which organisms take from the water. The reduced amount of oxygen, combined with the decreased transparency of the water, leads to the formation of deep zones known as dead zones. Therefore, the degree of oxygenation in the bottom waters is another criterion for eutrophication. The reduced amount of oxygen in the water and the poor transparency of the water cause a decline in biodiversity, especially in the case of seaweed and seagrass sensitive to the lack of light. Hence, the state of the so-called macrophytes
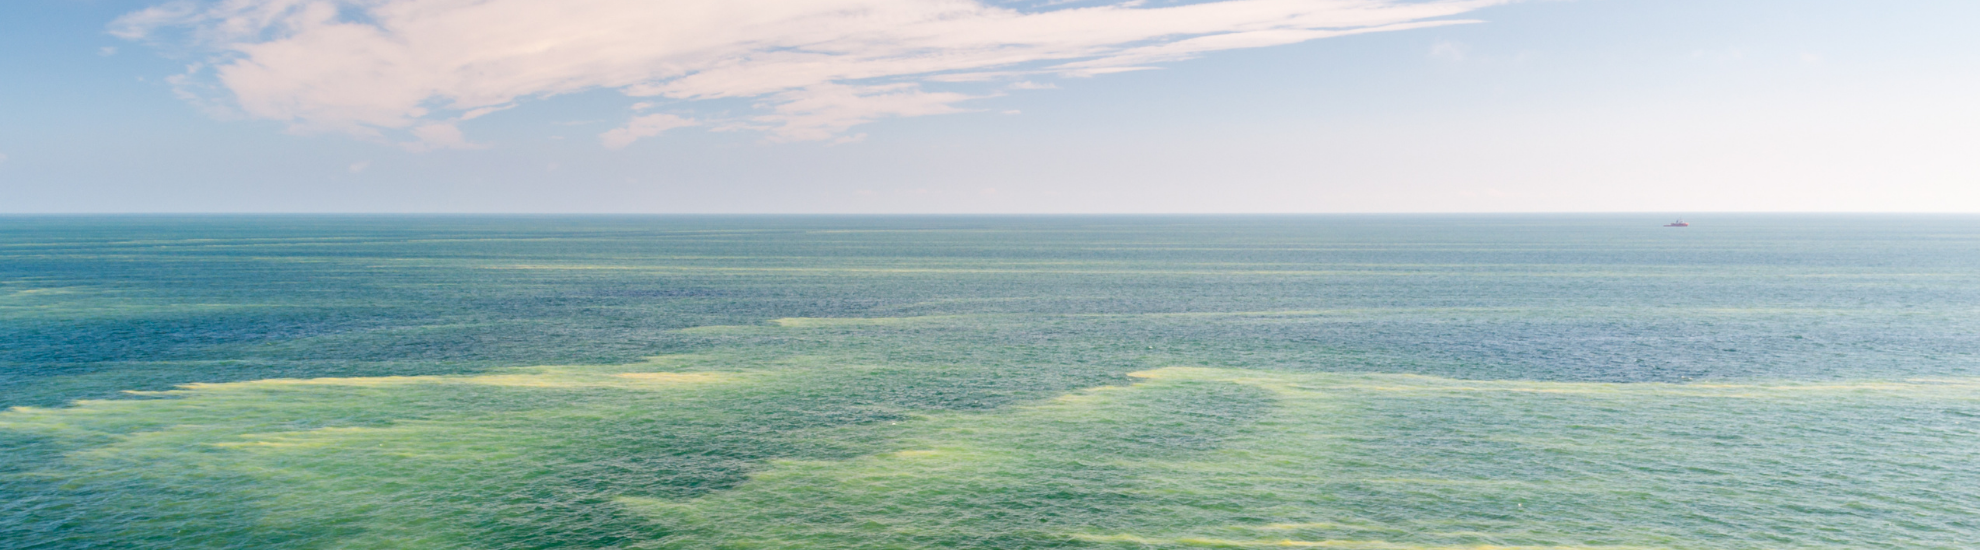
The effects of the eutrophication of the Baltic Sea affect not only aquatic organisms, but also us, users of coastal areas. The most famous and visible eutrophication effect is the mass blooms of cyanobacteria showing a green “scum” on the water surface. They can be visible even from long distances – in satellite images (Fig. 2). These blooms are also dangerous to human health, as cyanobacteria release various types of toxins into the water. Therefore, seaside bathing areas are closed at that time, being the bane of tourists coming to rest on the Polish coast.
PGW Waters Polskie is responsible for developing an update of the marine waters protection program (aPOWM). it will include a catalog of activities aimed at achieving good environmental status of marine waters – GES (Good Environmental Status) by improving the indicated features of the state and pressures. Eutrophication (feature 5) is a very significant pressure for the Baltic Sea, therefore the aPOWM document will propose many new actions to improve this situation, including disseminating phosphorus fertilization plans, introducing fees for nutrients in wastewater, extending monitoring and increasing requirements for the removal of nutrients in wastewater treatment plants, or catchment agricultural pollution reduction programs.
Activities under the project are carried out by governmental and local government units and entities, but they are also activities in which each of us can get involved. Together, we can stop eutrophication and protect the sea!
 Source: Copernicus Sentinel Data [2021],processed at the Satellite Teledetection Department, IMWM-PIB